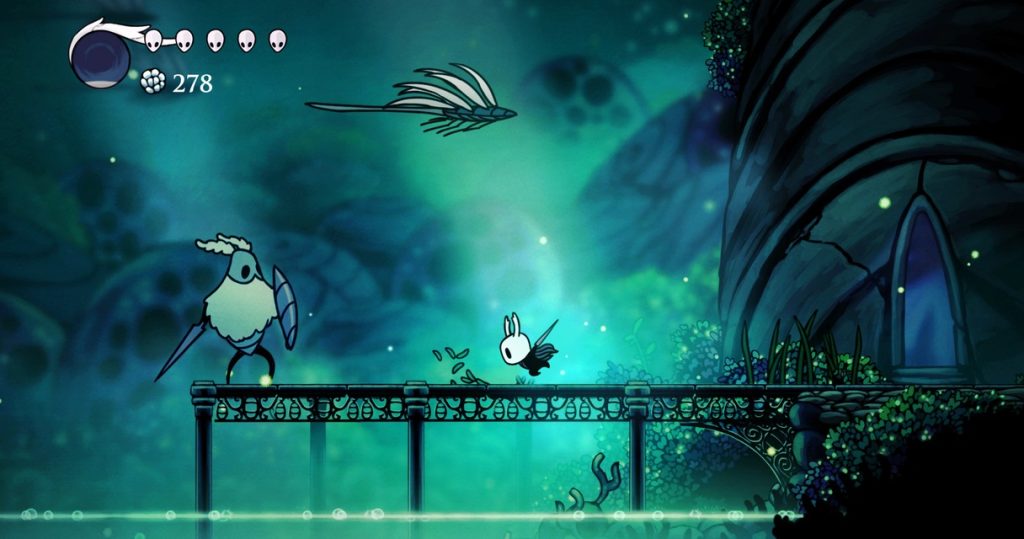
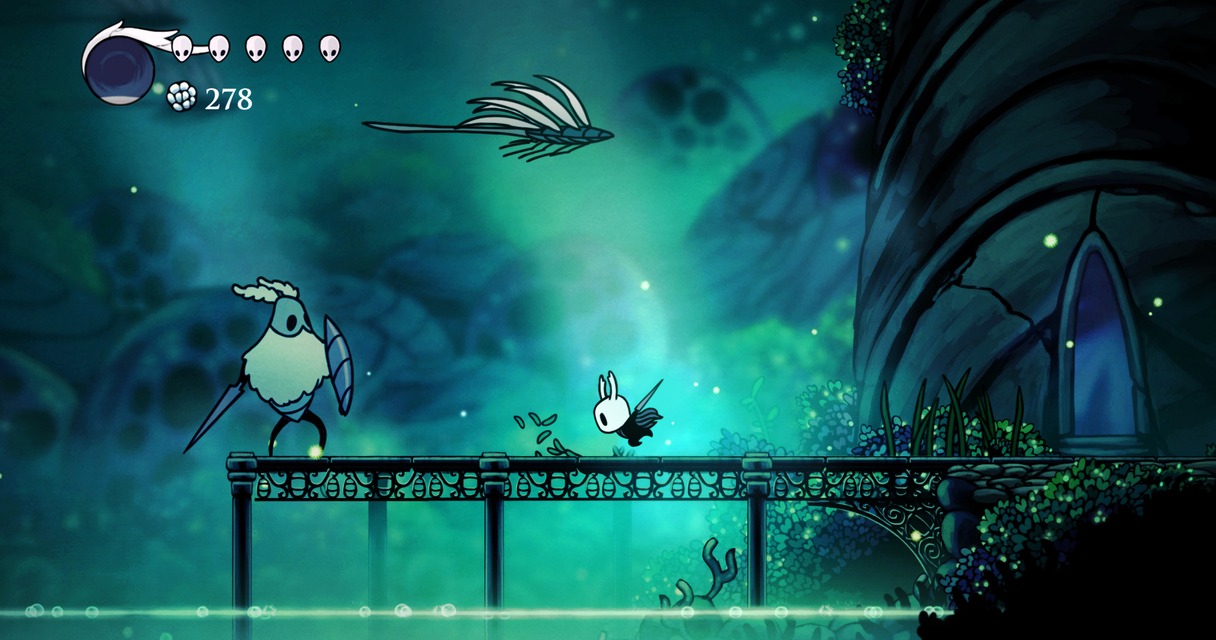
Designing interactive spaces that hold attention requires more than intuition; it demands measurable feedback. The relationship between a player’s skill and the challenges presented defines the core loop of any interactive experience. Metrics serve as the bridge between raw data and design intuition, allowing creators to fine-tune pacing, difficulty, and reward placement. Without systematic tracking, even the most artistic vision can miss the mark regarding player retention and satisfaction. This article explores the most effective measurements for understanding how audiences interact with crafted environments, focusing on the nuances that separate good designs from great ones.
Session Duration and Retention Curves
The most immediate indicator of interest is how long a participant remains active within a specific stage, best level. Session duration provides a raw count of minutes or seconds spent, but retention curves offer a deeper view of drop-off points. By tracking the percentage of users who exit at each milestone, designers can pinpoint moments of frustration or boredom. For instance, if a significant drop occurs immediately after a difficult boss encounter, it suggests the challenge may have been unfair or the transition punishing. Conversely, a steady climb in engagement often signals that the risk-reward balance feels fair. Analyzing these patterns allows for data-driven adjustments to pacing, ensuring that the experience remains compelling from the first interaction to the final credits.
Flow State Indicators and Churn Analysis
Beyond simple time spent, understanding the psychological state of “flow” is critical for maintaining engagement. Flow occurs when the challenge level perfectly matches the player’s current ability. Metrics such as death rates, retry frequency, and time-to-completion serve as proxies for this balance. High churn rates at specific junctures often indicate a difficulty spike that breaks the player’s concentration. Designers must look at the sequence of events leading up to these exits. Perhaps preceding sections were too easy, lulling the player into a false sense of security, or perhaps the control scheme introduced at that moment feels clunky. Churn analysis, when paired with qualitative feedback, reveals whether the player felt challenged or simply defeated.
Spatial Heatmaps and Interaction Density
Visualizing where players actually go versus where designers intended them to go is a powerful metric. Heatmaps track the frequency of player movement and interaction within a space. High interaction density in unexpected areas can signal hidden secrets that players love, or it can indicate that the main path is unclear and players are wandering aimlessly. Low density in key areas might mean objectives are too well-hidden or the visual language is confusing. By overlaying these maps with objective completion data, creators can distinguish between playful exploration and frustrating confusion. This data informs level geometry, guiding the eye toward intended paths through lighting, architecture, or object placement.
Resource Collection and Economy Metrics
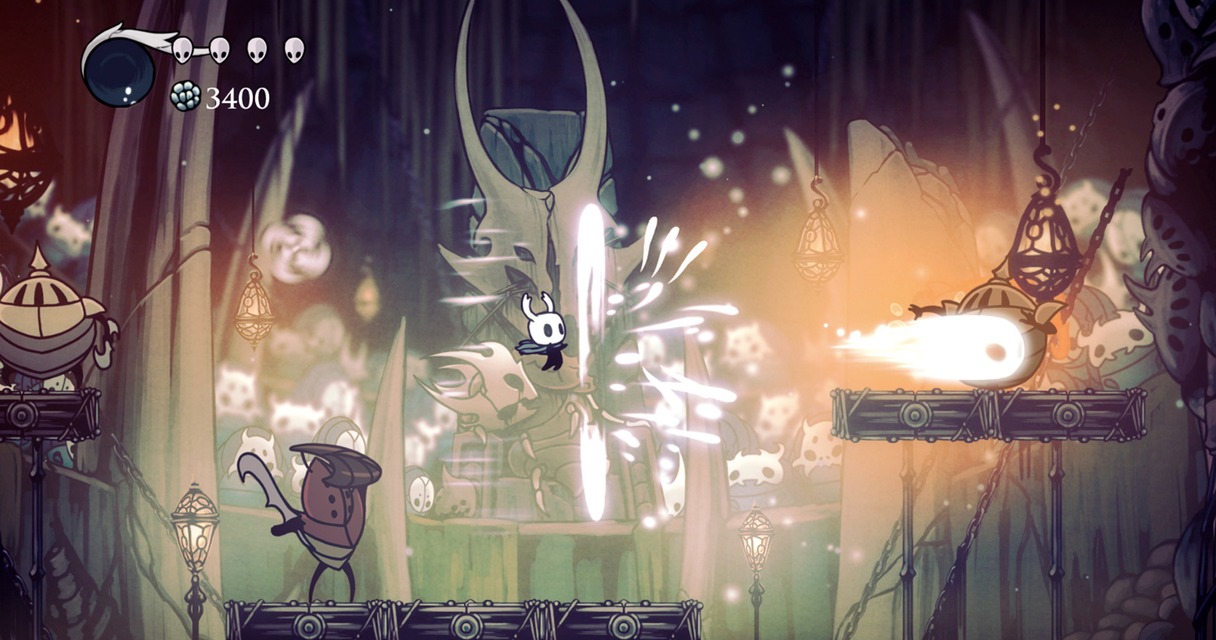
In games featuring collectibles, currency, or skill trees, tracking resource acquisition rates offers insight into player motivation. Are players gathering resources as expected, or are they skipping large sections of the design? Metrics regarding collection counts per session can reveal if the reward schedule is too sparse, leading to disengagement, or too abundant, causing the experience to feel like a chore. Furthermore, tracking the ratio of resources spent versus earned helps balance the in-game economy. If players consistently run out of a specific resource right before a major upgrade, it may be necessary to add more distribution points or adjust the cost of the upgrade to maintain a sense of progression.
Objective Completion Rates and Sequence Skipping
Not every player experiences a level in the way the designer intended. Tracking which primary objectives are completed and in what order provides a map of player agency. Some may bypass intended challenges entirely, finding sequence breaks or shortcuts. While this can be a sign of clever playtesting, it can also indicate that the intended path is overly linear or poorly signposted. Metrics should distinguish between “skipping” due to skill versus “skipping” due to confusion. High rates of objective skipping might suggest a need to re-evaluate the flow of the level, perhaps by adding signifiers or adjusting the layout to make the intended path more intuitive without stripping away player freedom.
Audio and Visual Cue Responsiveness
The sensory design of a level, lighting, sound, and particle effects, plays a massive role in guiding attention and evoking emotion. Metrics tracking the timing of player reactions to these cues can reveal if the sensory language is effective. For example, if a specific audio cue is meant to signal an approaching threat but players consistently fail to react in time, the cue may be too subtle or the visual indicator insufficient. Tracking the latency between cue presentation and player response helps fine-tune the “language” of the level. This ensures that the environment communicates clearly, reducing frustration and enhancing the overall sensory experience without breaking the immersion.

Post-Play Feedback Correlation
Quantitative data tells part of the story, but coupling it with qualitative feedback creates a complete picture. Metrics such as post-level ratings, skip rates, and time spent on the “exit” screen provide context for the numbers. If a level has high completion rates but low satisfaction scores, the design may be efficient but not enjoyable. Conversely, low completion rates with high praise might indicate a level that is frustrating yet memorable. Designers should analyze this correlation to decide whether to iterate on difficulty, pacing, or aesthetic tone. This holistic approach ensures that the final product resonates on both a mechanical and emotional level, fostering long-term loyalty among the audience.

I’ve been playing video games since I was a kid, and that passion naturally led me to explore how they’re made. I love diving into game design concepts and sharing insights with fellow enthusiasts. When I’m not testing new titles, I’m tinkering with Unity and learning new programming tricks.